The AI Race Is Actually a Manufacturing Race
China now generates more electricity than the United States, EU and India combined, and chips, workforce and robots follow the same pattern.

4300streetcar, CC BY 4.0, via Wikimedia Commons
Start with one number: in 2025, China generated more electricity than the United States, the European Union and India combined, roughly 10,578 terawatt-hours against a combined 9,398. In 2000, China’s grid produced barely a third of America’s. It overtook the US around 2010, and it has kept pulling away every year since, most recently adding more new generation in a single year than Germany’s entire national grid produces in twelve months. That single fact, verified independently by the energy research group Ember rather than claimed by any government, is the cleanest place to start a piece about the “AI race,” because it explains something the chip headlines usually skip: training and running large AI models, the models that increasingly sit inside drone autopilots, radar processors and satellite tasking software, takes electricity at industrial scale, and one competitor is building that capacity roughly ten times faster than the other two combined.
Every one of the four races below resolves to the same question a procurement officer actually asks: can you build the thing, and can you keep building it if someone cuts you off? Chips decide whether a missile can see. Electricity decides whether you can train the model that flies the drone. Engineers decide whether anyone is standing at the production line. Robots decide how fast that line runs. What follows is a data-first walk through all four, with every Chinese, Russian or state-affiliated figure flagged as a claim rather than a fact, exactly as WeaponSpecs treats any other manufacturer or government-sourced spec.
Who Actually Makes the Chips Modern Weapons Depend On?

The foundry business, the companies that physically fabricate other firms’ chip designs, is the most concentrated major manufacturing sector on earth. In the first quarter of 2026, Taiwan’s TSMC held 72% of global foundry revenue, up from 70.4% the previous quarter, according to market researcher TrendForce. South Korea’s Samsung Foundry trailed a distant second at 6.5%. China’s SMIC held 5.1%, ahead of Taiwan’s UMC (3.9%) and the US-headquartered GlobalFoundries (3.3%).
TSMC alone out-produces every other foundry on earth combined, by revenue. A single fire, earthquake, or blockade at one company's fabs in one country would be a global supply shock, not a regional one.
That concentration is a recent inversion. The Semiconductor Industry Association testified to Congress that the United States held 37% of global chip manufacturing capacity in 1990; by 2021 that share had fallen to 12%. A follow-up SIA/BCG study put US capacity at just 10% in 2022, projecting a rebound to only 14% by 2032 even after hundreds of billions of dollars in subsidies and private investment. As of 2021, 100% of sub-10-nanometer logic capacity sat in Taiwan (92%) and South Korea (8%), with none in the US, China or Europe at all.
The single company that makes all of that leading-edge fabrication physically possible is Dutch: ASML, the sole global supplier of extreme-ultraviolet (EUV) lithography machines, the tool that etches the smallest transistor features in existence. ASML reported €32.7 billion in net sales and €9.6 billion in net income for 2025, shipping 48 EUV systems that year, up from 44 in 2024. A single standard EUV machine costs roughly €180 million; the newest High-NA variant runs closer to $400 million per unit. China accounted for 33% of ASML’s 2025 sales, but the company guides that share down to roughly 20% for 2026 as export licensing tightens, and ASML states it has never shipped a single EUV system to China at all.

The United States is trying to buy its way back in. TSMC has now committed $165 billion to a six-fab cluster in Arizona, up from an initial $12 billion pledge in 2020, though the most advanced production still runs in Taiwan first. Intel, the only US-owned company still fabricating leading-edge logic at all, claims its new 18A process is “the first 2-nanometer class node developed and manufactured in the United States,” built at Fab 52 in Chandler, Arizona. Washington has also started buying defense-specific capacity directly: Intel holds up to $3 billion for a “Secure Enclave” program building leading-edge chips exclusively for defense and intelligence use, on top of its role in the Pentagon’s RAMP-C initiative.
Europe’s own attempt, the €43 billion EU Chips Act, is not on track. The bloc’s share of global chip production sat at 9.8% in 2022 against a stated target of 20% by 2030; the European Court of Auditors’ own April 2025 audit projects only 11.7% by 2030, calling the target “very unlikely” to be reached. As ECA member Annemie Turtelboom put it plainly, the EU’s microchips strategy needs “a reality check.”
What Happens to a Weapons Program When the Chips Stop Coming?

Chips are not a side ingredient in a modern weapons platform, they are load-bearing. Per reporting from Defense Daily, the F-35A contains more than 3,000 microchips; the CH-53K heavy-lift helicopter carries more than 2,000; even a shoulder-fired Javelin anti-tank missile carries more than 250. President Biden made the same point on the factory floor of the Javelin production line in Troy, Alabama, in 2022, noting the missile itself contains “more than 200 semiconductors.”
The consequence of losing access to those chips is documented, not theoretical. The Royal United Services Institute’s 2022 report “Silicon Lifeline” examined 27 of Russia’s most modern military systems recovered from the battlefield and traced Western-made electronic components, from the US, Japan, Taiwan, South Korea and several European states, inside nearly all of them, evidence of how dependent even a major arms-exporting state is on a global chip supply chain it does not control. Sanctions since 2022 have forced Russia into black-market and third-country workarounds for exactly that reason.
That dependency runs in the other direction too, on materials rather than finished chips. Gallium is the base element for gallium nitride (GaN), the semiconductor material inside modern active electronically scanned array (AESA) radars, the kind fitted to platforms like the F-35’s own APG-85 and the US Army’s LTAMDS air-defense radar. China refines roughly 99% of the world’s gallium supply, per the International Energy Agency, and dominates refining for 19 of 20 other energy-critical minerals at an average 70% share. Beijing has already used that leverage: it began licensing gallium and germanium exports in August 2023, added antimony controls in September 2024, then imposed an outright export ban on all four elements to the United States on December 3, 2024, one day after Washington’s own latest chip-equipment restrictions. In October 2025 it went further, requiring a Chinese export license for any foreign-made magnet containing even 0.1% Chinese-origin rare earth content by value, a rule modeled directly on the US’s own “foreign direct product” export-control mechanism.
“The new restrictions will only deepen these vulnerabilities, further widening the capability gap and allowing China to accelerate the expansion of its military strength at a faster pace than the United States,” warned Gracelin Baskaran, Director of the Critical Minerals Security Program at CSIS, on the October 2025 rare-earth restrictions (CSIS, 9 Oct 2025).
Did the Export Controls Actually Work?
Washington’s own doctrine on this question was stated plainly by National Security Advisor Jake Sullivan in September 2022, just weeks after the first major chip export-control package: “Given the foundational nature of certain technologies, such as advanced logic and memory chips, we must maintain as large of a lead as possible.” That package has been tightened repeatedly since, most significantly in a December 2024 round covering 24 categories of chipmaking equipment and adding 140 Chinese entities to the restricted list, followed by a brief, contested “AI Diffusion Rule” issued in January 2025 and rescinded four months later.
The chip industry’s own read on whether it worked is split, sometimes inside the same company. Nvidia CEO Jensen Huang, whose firm saw its China AI-chip market share fall from roughly 95% before the controls to near zero by 2026, told an audience at Computex in May 2025:
“All in all, the export control was a failure… The local companies are very, very talented and very determined, and the export control gave them the spirit, the energy, and the government support to accelerate their development.”
The physical evidence supports part of that claim and undercuts the rest. In September 2023, the semiconductor analysis firm TechInsights tore down a Huawei Mate 60 Pro phone and confirmed its Kirin 9000S chip was fabricated on SMIC’s 7-nanometer (N+2) process, without using any EUV lithography tools, exactly the class of equipment export controls are meant to deny China. That is a genuine technical achievement under sanction. It is also, measured against TSMC’s and Samsung’s current 2-nanometer-class production, several full node generations behind the leading edge, and SMIC has shown no independently confirmed path to close that gap without the equipment it still cannot legally buy. Read together, the Sullivan doctrine, the Huang rebuttal and the TechInsights teardown describe the same reality from three angles: controls did not stop China’s chip industry, and they have not let it catch up either.
Can You Fight an AI War Without the Electricity to Train It?
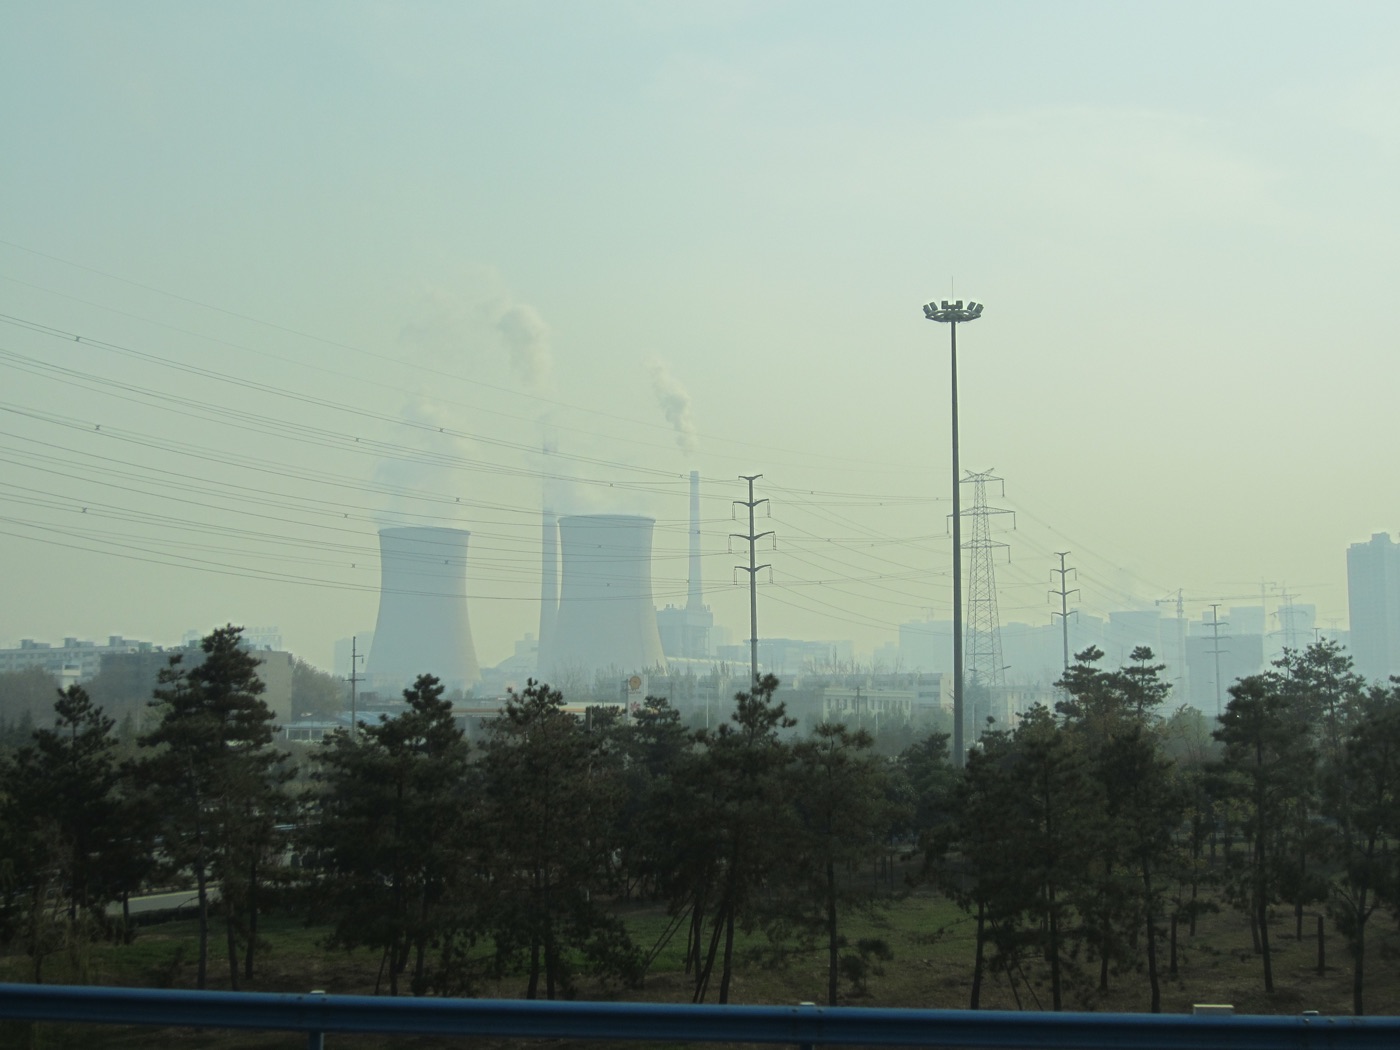
This is the dimension every chip headline skips, and it may matter more than any of them. Training a frontier AI model, and running the data centers that increasingly handle military intelligence, surveillance and reconnaissance processing, consumes electricity at industrial scale. The independent energy research group Ember, using generation data it publishes openly rather than sourcing from any government, shows a trajectory that looks nothing like a level playing field.
Electricity Generation, 2000 vs 2025 (TWh)
| Country / bloc | Generation, 2000 (TWh) | Generation, 2025 (TWh) | Change |
|---|---|---|---|
| China | 1,356 | 10,578 | +680% |
| United States | 3,802 | 4,520 | +19% |
| EU-27 | 2,622 | 2,797 | +7% |
China's raw increase, +9,222 TWh since 2000, is worth more than the percentage: that single addition is over twice the size of the United States' entire current grid, built from scratch in a quarter century.
China's grid grew nearly 8x in a quarter century while the US grid grew less than one-fifth and the EU's barely moved at all.
Add India’s 2025 generation (roughly 2,082 TWh) to the US and EU-27 totals above and the combined figure, 9,398 TWh, still falls short of China’s 10,578 TWh alone. Per Ember’s 2026 review, China’s demand growth is not slowing down: it added 503 TWh in 2025, a single year’s addition bigger than Germany’s entire annual output of roughly 500 TWh. The US, by contrast, grew demand just 0.6% a year on average across 2015 to 2024, essentially flat, before accelerating to 3.0% growth in 2025, a shift Ember attributes largely to data-center buildout. The EU-27’s 2025 output, meanwhile, still sits 5.5% below its 2008 peak and below its own 2019, pre-pandemic level.
Nuclear power shows the same asymmetry even more starkly. Per the IAEA’s own reactor database, China has 37 reactors under construction (39,952 MW), roughly half the entire world total of 77 reactors (80,720 MW) under construction. The United States has zero reactors under construction and does not appear on the list at all; the EU has two, in Hungary and Slovakia, totaling 1,625 MW.
Why this matters for AI specifically: the International Energy Agency estimates global data-center electricity use at roughly 415 terawatt-hours in 2024, about 1.5% of world electricity, rising to nearly 945 TWh by 2030. Of that 2024 total, the US accounted for about 45%, China about 25%, and Europe about 15%. The US Department of Energy’s own Lawrence Berkeley National Laboratory found American data-center consumption alone rose from 58 TWh in 2014 to 176 TWh in 2023 (4.4% of all US electricity), projecting it could reach 325 to 580 TWh, 6.7% to 12% of the entire US grid, by 2028. Brookings researchers project China’s data-center demand reaching roughly 277 TWh by 2030 against roughly 426 TWh for the US, a race both nations are now running against their own grid capacity, not just against each other’s chip labs.
“AI is an energy intensive manufacturing industry,” said Chris Wright, US Secretary of Energy, at CPAC in February 2025. “We need to lead and win the competition in AI, and the only way to do that is to have tremendous energy production… I would feel naked if their AI was better than ours.”
“The United States has the upper hand in access to cutting-edge AI semiconductors, China has a significant advantage in energy,” wrote Kyle Chan, a fellow at Brookings’ John L. Thornton China Center. “This ‘electron gap’ could potentially reshape the balance of compute for AI between the two countries” (Brookings, 8 Jan 2026).
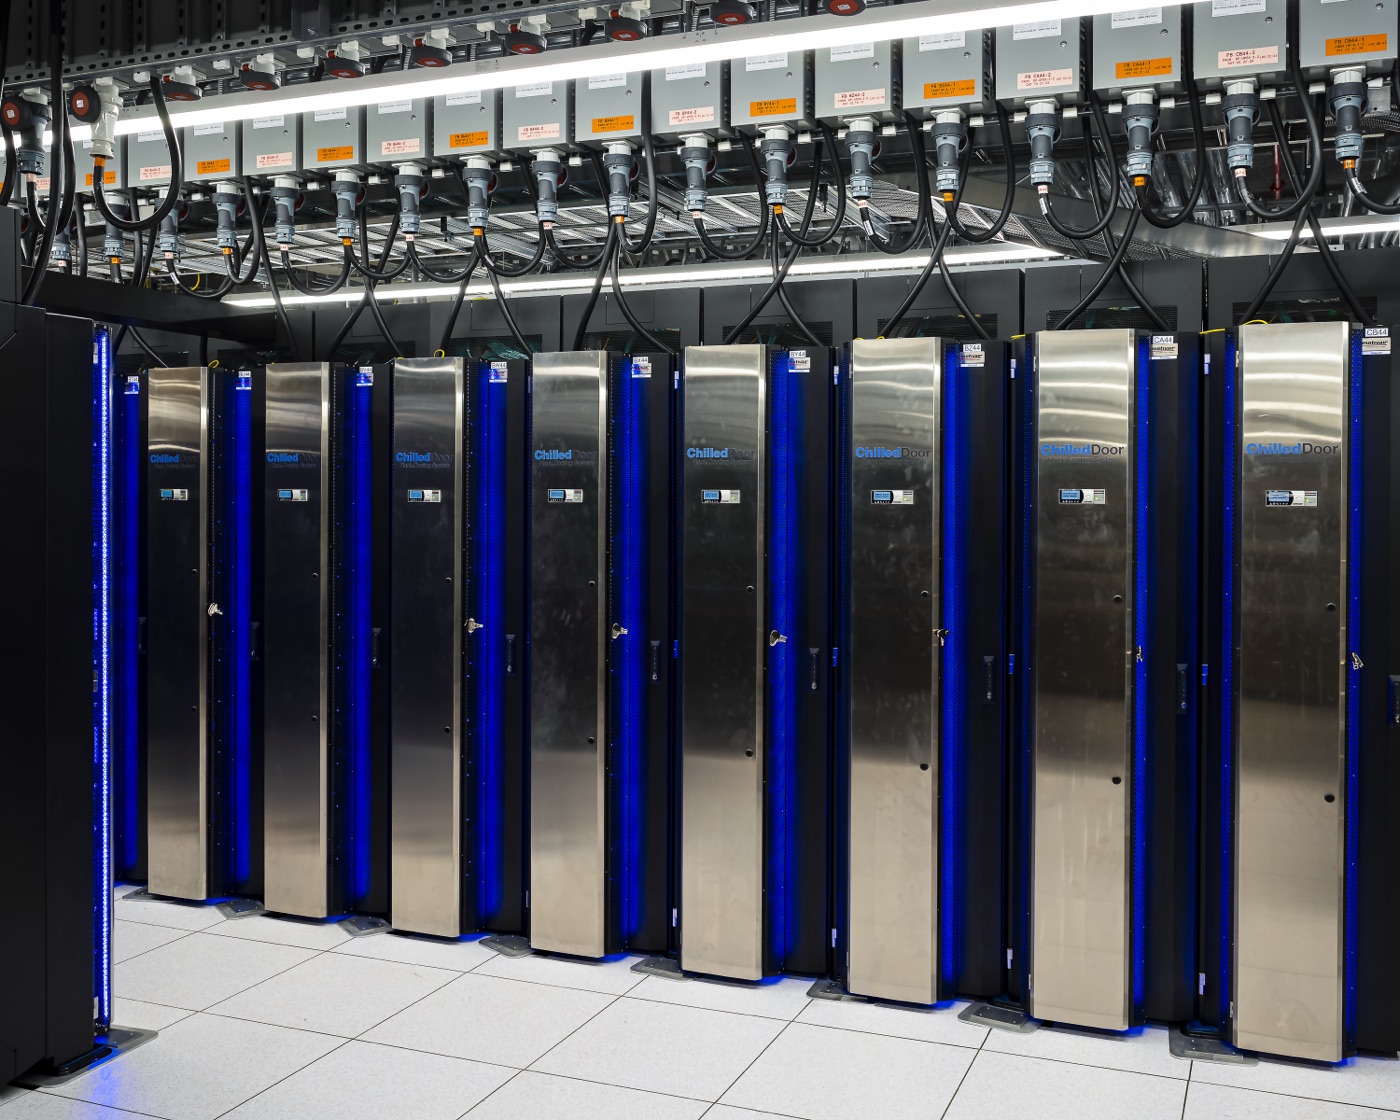
The defense angle here is not hypothetical. The world’s single most powerful supercomputer, El Capitan, run by the US Department of Energy’s National Nuclear Security Administration at Lawrence Livermore National Laboratory for nuclear-weapons stockpile stewardship, draws roughly 29.7 megawatts of continuous power on its own. Its DOE sibling systems Frontier and Aurora draw a further 24.6 MW and 38.7 MW respectively. The three most powerful computing systems on earth all sit inside the US national laboratory system, and all three are, functionally, defense infrastructure with an enormous, unglamorous power bill attached.
Why Is Europe Losing Both the Chip Race and the Power Race?
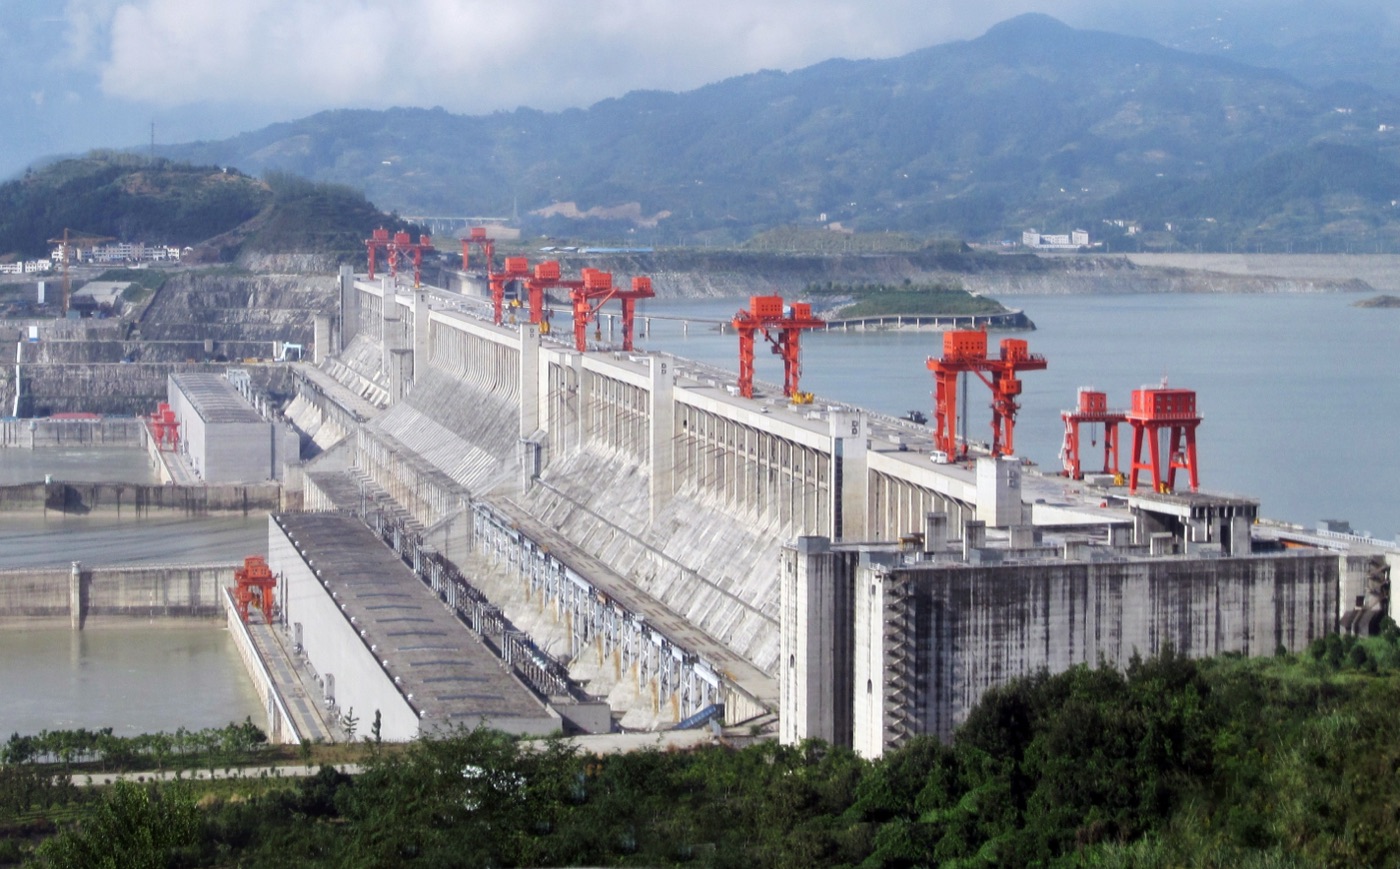
Europe’s two weak spots compound each other. The bloc’s chip strategy is already falling short of its own target, as covered above, and its grid has been shrinking, not growing: EU-27 generation is down 5.5% since 2008, and Germany specifically, the bloc’s industrial engine, generated roughly 22% less electricity in 2025 than at its 2015 peak. Neither France nor the US has a single reactor under construction, while China alone accounts for roughly half the world’s nuclear buildout by capacity.
The clearest single comparison of grid-building speed is annual capacity additions. The US added 53 gigawatts of new generating capacity in 2025, per the Energy Information Administration, its largest single-year addition since 2002. China added 434 gigawatts of wind and solar capacity alone that same year, before counting coal, nuclear or hydro, roughly eight times the entire US addition across every technology combined. China’s own National Energy Administration, a Chinese state source and flagged as such here, also reports 45 ultra-high-voltage transmission lines now in operation, carrying power over distances no Western grid attempts at that scale, and a further $580 billion transmission-investment plan for 2026 to 2030. None of those Chinese figures are independently audited the way Ember’s or the IEA’s data is, but even accounting for that caveat, the direction of the gap is not in dispute.
“China has taken [ultra-high-voltage transmission] to the next level and pushed the envelope,” Ismael Arciniegas Rueda, an energy and transmission economist at RAND Corporation, told the BBC.
Does Anyone Have Enough Engineers Left to Build What They Promised?
Chips and electricity are useless without people to design, build and maintain the systems around them, and the workforce numbers are as lopsided as the energy numbers. Per CSET at Georgetown, China produced roughly 3.57 million STEM graduates in 2020, against 2.55 million for India and just 820,000 for the United States. The gap sharpens at the doctoral level, the credential that actually staffs advanced weapons engineering: US federal data (NSF’s National Center for Science and Engineering Statistics) shows China awarding 53,385 science and engineering doctorates in 2022 against 44,739 for the US in 2023, and specifically 30,121 engineering doctorates versus the US’s 12,197, a 2.5-to-1 gap in exactly the discipline that designs weapons platforms. China first overtook the US in STEM doctorates around 2007; in 2000 the US had still been awarding twice as many.
STEM Graduates by Country, 2020
| Country | STEM graduates, all levels (2020) |
|---|---|
| China | 3,570,000 |
| India | 2,550,000 |
| United States | 820,000 |
| Russia | 520,000 |
| France | 220,000 |
| Germany | 216,000 |
| Japan | 192,000 |
China and India together, the two most populous countries on this list, account for roughly three-quarters of the STEM graduates produced by all seven countries combined in 2020.
The US defense-industrial base has watched its own workforce shrink for decades even as its mission grew. The National Defense Industrial Association’s Vital Signs report puts the US defense-industry workforce at 3 million in 1985, down to 1.1 million by 2021, nearly a two-thirds decline. NDIA’s 2026 edition found talent the single most pressing concern for government respondents (51%), ahead of every other supply-chain issue. Naval shipbuilding illustrates the shortfall concretely: the industry needs 174,000 new workers over the next decade, against reported first-year attrition rates as high as 50 to 60%.
“There is no way to improve the condition of the shipbuilding industrial base with attrition rates that high,” said Eric Labs, senior analyst for naval forces and weapons at the Congressional Budget Office (National Defense Magazine, 31 Mar 2025).
Europe’s picture here is genuinely mixed, unlike its chip and grid numbers. European aerospace and defense employment actually reached its highest level ever recorded in 2024, 1.1 million workers, up 6.9%, per industry group ASD Europe, with the defense segment growing even faster at 8.6%, a real hiring boom driven by the continent’s post-2022 rearmament push. But Germany’s broader engineering labor market is now cooling in the civilian economy: engineering and IT vacancies fell 23% year-on-year in the third quarter of 2025, per the VDI/IW Ingenieurmonitor, suggesting the defense hiring surge is drawing from, not adding to, an already tightening talent pool.
Who Actually Has the Robots, and Why Did China’s Ranking Just Collapse?
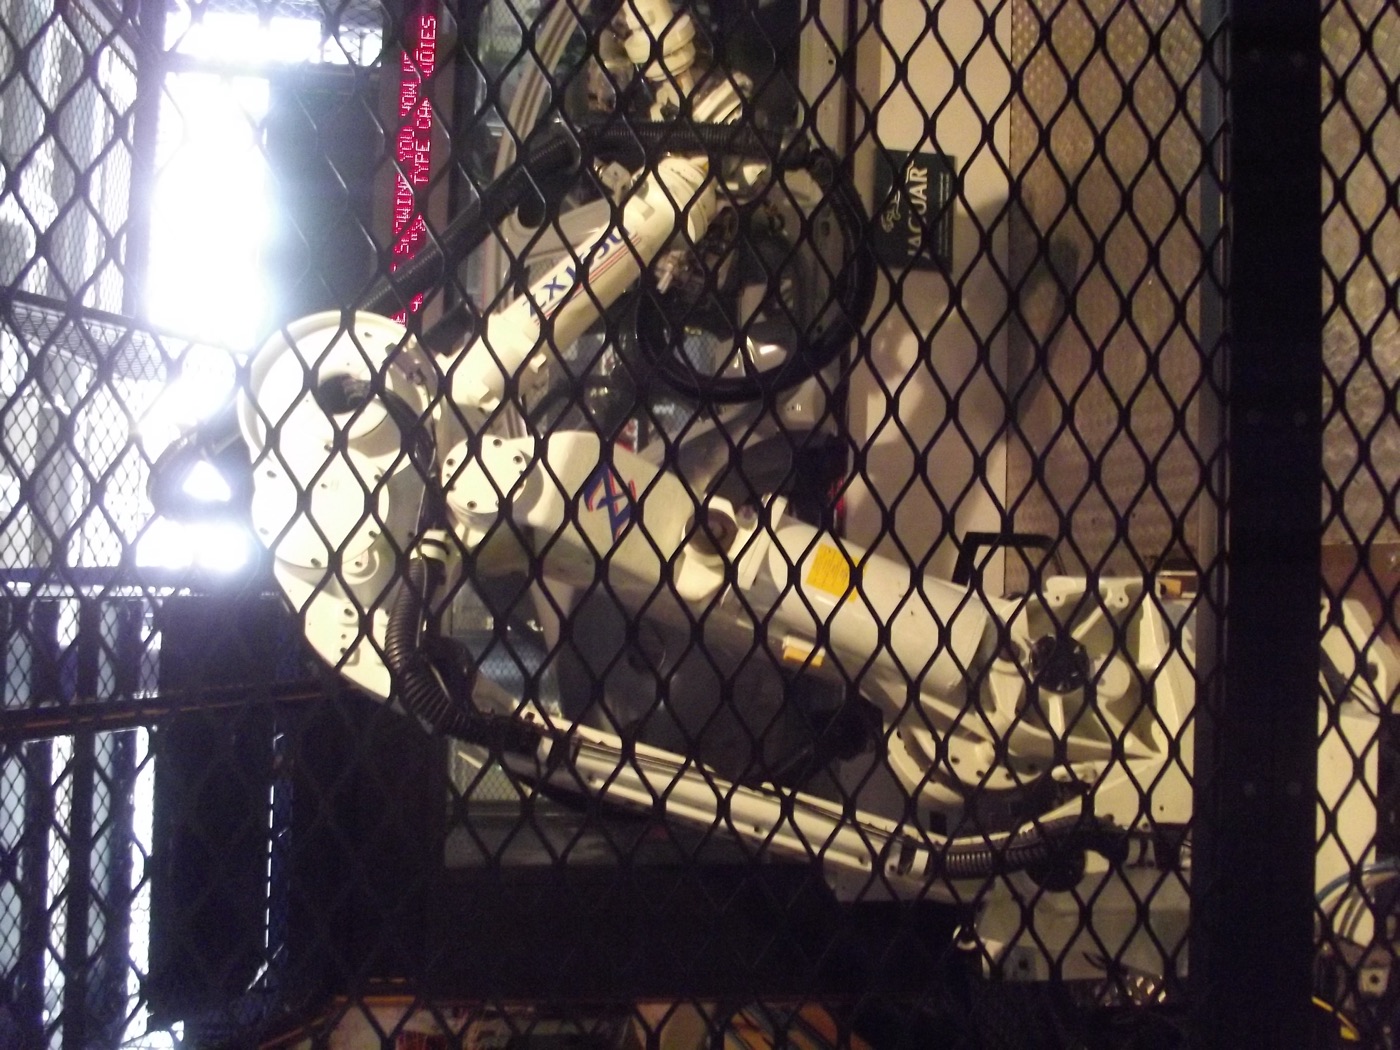
Robotics is where the manufacturing-race framing is most literal, and where a single foreign statistical revision produced the sharpest case study in this entire piece for why WeaponSpecs treats state figures as claims rather than facts.
On raw installations, there is no contest: the International Federation of Robotics counted 542,000 industrial robots installed worldwide in 2024, more than double the roughly 271,000 installed in 2014. China alone installed 295,000 of those, 54% of the global total, more than the next dozen countries combined. Japan (44,500), the United States (34,200), South Korea (30,600) and Germany (26,982) followed well behind.
China installs roughly ten times as many industrial robots per year as the United States, and Chinese domestic vendors now supply 57% of them, up from about 28% a decade ago.
But installations are not the same measure as density, robots per 10,000 manufacturing workers, and density is where the story gets genuinely strange. In the IFR’s 2025 report, covering 2024 data, China ranked 22nd globally at 166 robots per 10,000 workers, behind South Korea (1,220, first place), Singapore (818), Germany (449), Japan (446), Sweden (377) and the United States (307, 8th place). In the IFR’s previous report, covering 2023 data, China had ranked 3rd globally at 470 robots per 10,000 workers, ahead of both Germany and Japan.
China did not lose two-thirds of its industrial robots in a single year. Per the IFR itself, the swing is because China’s own National Bureau of Statistics revised the labor-market data used as the denominator in the calculation, which also pulled the global average down from 162 to 132 robots per 10,000 workers in the same revision. It is a live, recent, and unusually clean example of exactly the risk WeaponSpecs flags every time it cites a Chinese state figure: change the denominator in Beijing, and a headline global ranking changes with it, with no change at all on any actual factory floor.
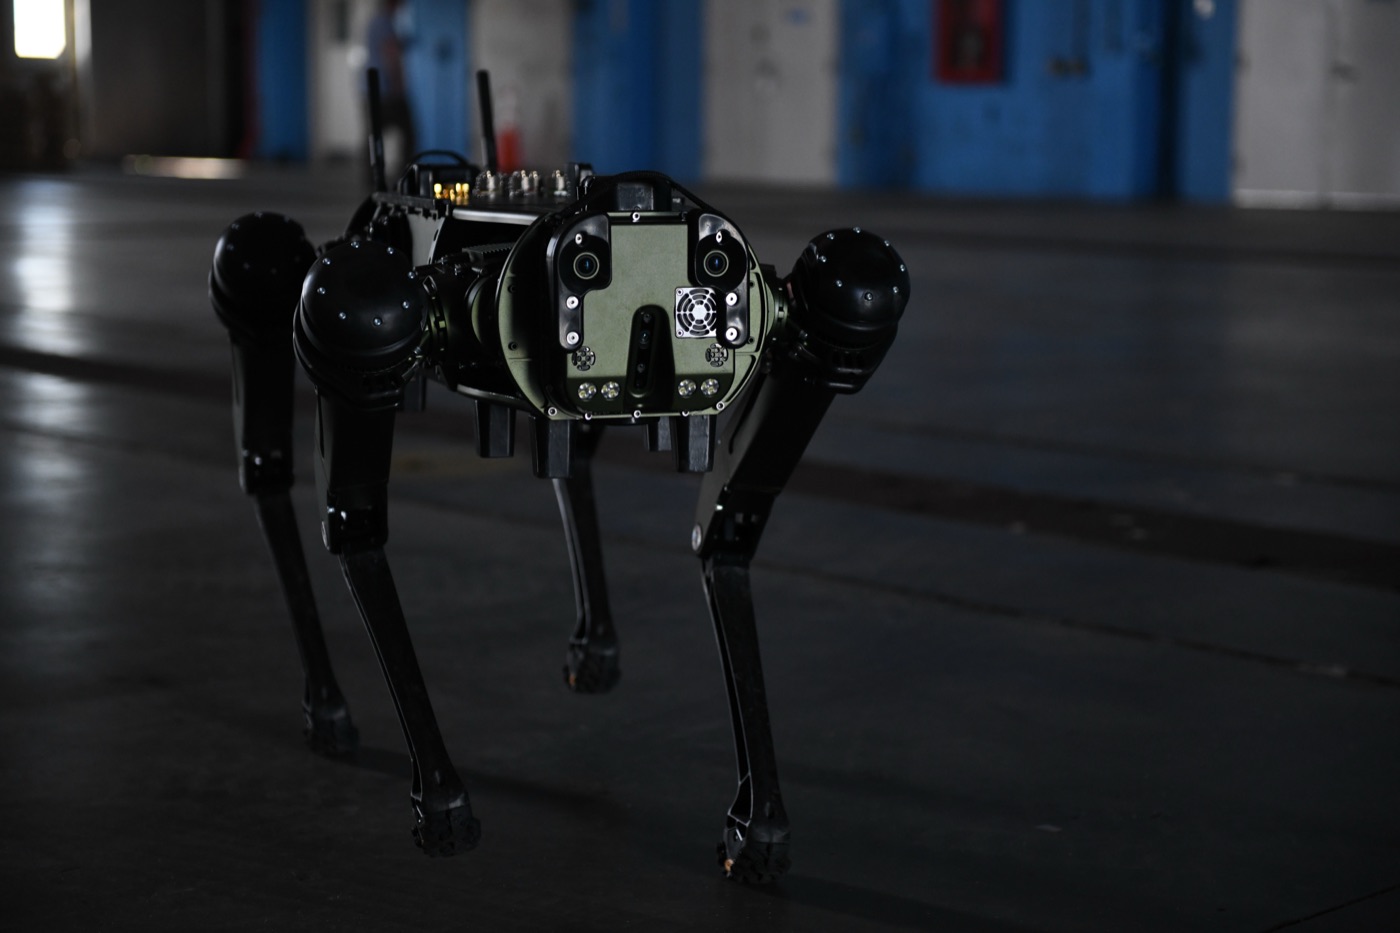
The company layer underneath these numbers is worth naming, because ownership crosses borders in ways the country totals hide. Fanuc, ABB and Yaskawa remain the incumbent industrial-arm suppliers worldwide, but the fourth member of that traditional “big four,” Germany’s KUKA, has been majority-owned by China’s Midea Group since 2017 and fully owned since 2022, a European robotics champion now under Chinese corporate control. On the defense-robotics side specifically, the US firm Anduril has raised its valuation past $60 billion on the strength of autonomous systems like its Fury drone and Roadrunner interceptor, and is building a dedicated high-volume “Arsenal-1” manufacturing plant in Ohio. China’s Unitree, maker of widely exported quadruped and humanoid robots, is preparing a Shanghai stock listing, a reminder that the same commercial robotics boom feeding factory floors is also feeding directly into next-generation military hardware on both sides.
The Bottom Line: Four Races, One Constraint
Line the four dimensions up and a single pattern holds across all of them. In chip fabrication, the West and its allies (Taiwan, South Korea, the Netherlands, the US) still hold the genuine chokepoint, TSMC and ASML between them control the physical means of production for the world’s most advanced logic, and China’s own 7-nanometer breakthrough, while real, still trails that edge by several generations. In electricity, workforce and robot installations, the trend line runs the other way: China is building grid capacity, awarding engineering doctorates and installing industrial robots at a pace neither the US nor the EU is currently matching, even before accounting for the caveats that belong on several of Beijing’s own headline figures.
None of that adds up to a simple “who’s winning” scoreboard, and treating it that way would be exactly the kind of oversimplification this site exists to push back against. It adds up to something more specific and more useful: a map of where the real constraints sit. A country with abundant chips but a shrinking grid cannot train the models its chips are capable of running. A country with abundant power but no advanced fabrication cannot build the hardware that power is meant to feed. And a country with plenty of both still needs enough trained engineers standing at the production line, and enough robots on that line, to turn either advantage into actual, fielded weapons systems rather than a chart.
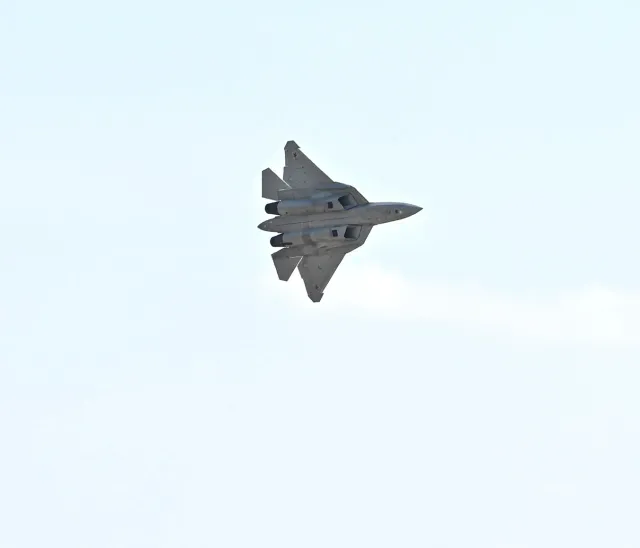
Explore the platforms most directly shaped by these supply chains, the F-35A Lightning II, MQ-9A Reaper, J-20 and Su-57, in the fighter and UAV categories, or run your own side-by-side in Compare.
Sources
- TSMC leads global foundry revenue with 72% share in 1Q26 (TrendForce)
- ASML 2025 Annual Report
- Commerce Strengthens Export Controls (BIS press release, Dec 2024)
- China's Rare Earth Export Ban (CSET, Georgetown)
- Energy and AI (IEA)
- De-Risking Gallium Supply Chains (CSIS)
- Silicon Lifeline: Western Electronics at the Heart of Russia's War Machine (RUSI)
- TechInsights Finds SMIC 7nm (N+2) in Huawei Mate 60 Pro
- Intel Foundry Adds Customers to RAMP-C Project for US Defense
- European Court of Auditors Special Report 12/2025 on the EU Chips Act
- The Global Distribution of STEM Graduates (CSET, Georgetown)
- NDIA Vital Signs 2025
- Navy, Industry Try to Reverse Course on Workforce Woes (National Defense Magazine)
- Robot Density Surges in Europe, Asia and the Americas (IFR, 2025 report)
- Global Robot Demand in Factories Doubles Over 10 Years (IFR)
- Global Robot Density in Factories Doubled in Seven Years (IFR, 2023 report)
- ASD Europe Facts & Figures 2024
- How Will the United States and China Power the AI Race? (Brookings)
- Remarks by National Security Advisor Jake Sullivan (SCSP, Sept 2022)
- Jensen Huang: US Chip Export Controls Were 'a Failure' (Yahoo Finance)
- US Secretary of Energy Chris Wright Delivers Remarks at CPAC (DOE)
- PRIS: Reactors Under Construction by Country (IAEA)
- TSMC Arizona (Wikipedia)
Systems in this comparison
Every system covered above, with its photo and, where available, a video. Tap a card to open the full spec sheet.
Compare these side by side →
Fighter aircraft
F-35A Lightning II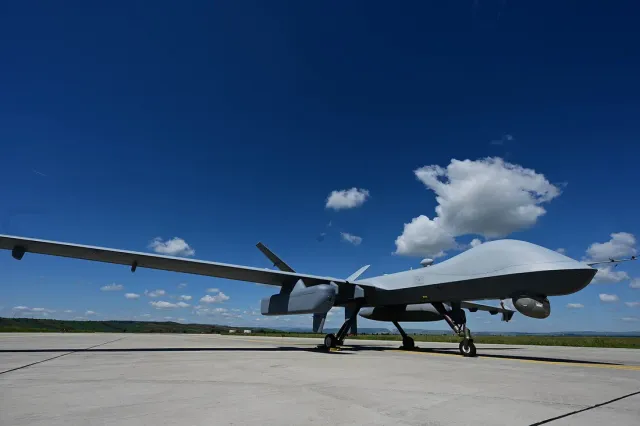
UAV / drone
MQ-9A Reaper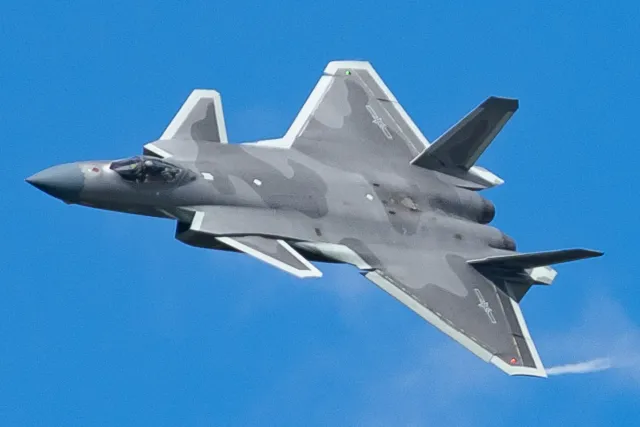

UAV / drone
Bayraktar TB2
Frequently asked questions
Which country manufactures the most advanced chips used in modern weapons? +
Taiwan's TSMC alone held 72% of global contract-chip revenue in the first quarter of 2026, and it or South Korea's Samsung fabricate essentially all sub-10-nanometer logic, the class of chip inside modern radar processors, missile seekers and AI-enabled sensor fusion. China's SMIC has confirmed 7-nanometer production but nothing close to that leading edge, and no country outside Taiwan and South Korea currently ships cutting-edge logic at scale.
Does China really generate more electricity than the US, EU and India combined? +
Yes, as of 2025. China generated roughly 10,578 terawatt-hours against a combined 9,398 for the United States, the EU-27 and India, per Ember's independent Global Electricity Review. China was generating barely a third of the US total in 2000; it overtook the US around 2010 and has kept pulling away since, adding more new generation most years than Germany's entire annual output.
Have US chip export controls actually slowed China's military AI progress? +
The honest answer is contested and worth reading both sides of. Nvidia's own CEO has called the controls 'a failure' that pushed China's domestic chipmakers to accelerate. But a physical teardown of a 2023 Huawei phone confirmed China's SMIC had only reached 7-nanometer production without the extreme-ultraviolet lithography tools export controls specifically deny it, several node generations behind TSMC's and Samsung's leading edge. Both things are true at once: China adapted, and it still trails.
Which country has the most industrial robots, and why did China's global ranking suddenly fall? +
China installs by far the most robots each year, 295,000 in 2024, 54% of the world's total. But on robot density (robots per 10,000 manufacturing workers), the International Federation of Robotics ranked China third globally in its 2024 report and twenty-second in its 2025 report, a collapse the IFR attributes not to China losing robots but to China's own National Bureau of Statistics revising its labor-market denominator. It is a clean example of why a single foreign-government statistic can rewrite a global ranking overnight.
Why does WeaponSpecs flag figures from Chinese, Russian, Iranian and North Korean sources? +
Because state and manufacturer figures from those governments are not independently audited the way Western regulatory filings, IAEA inspections or IFR industry surveys typically are. This piece flags every Chinese-state-sourced number explicitly, including a case where a single Chinese statistical revision cut a widely cited global robotics ranking by two-thirds in one year, precisely the risk the caveat exists to manage.
Related reading


